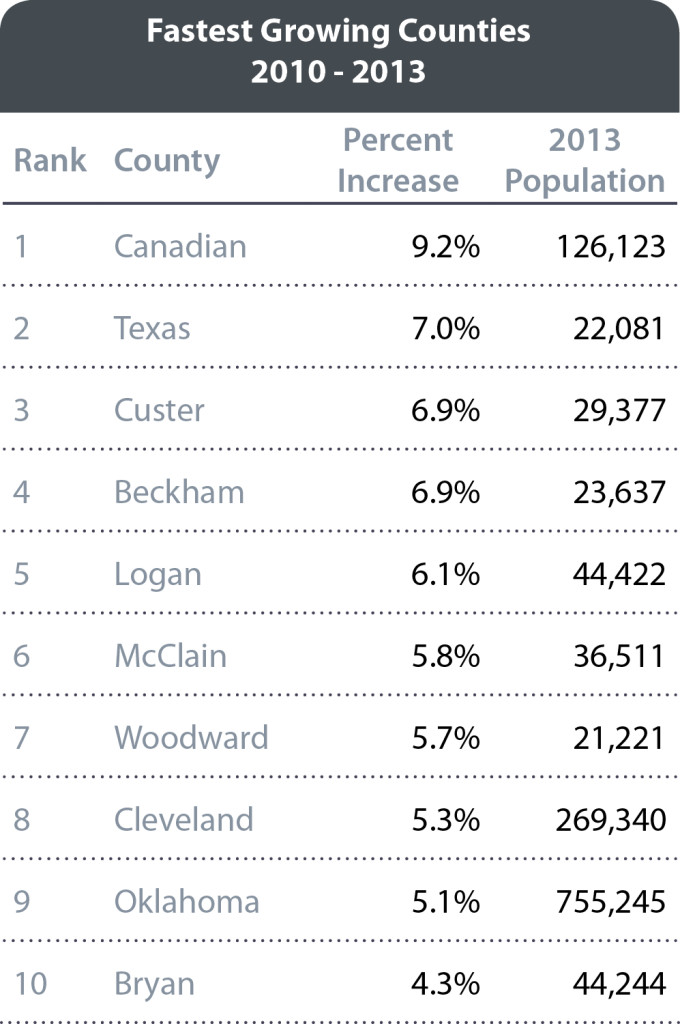
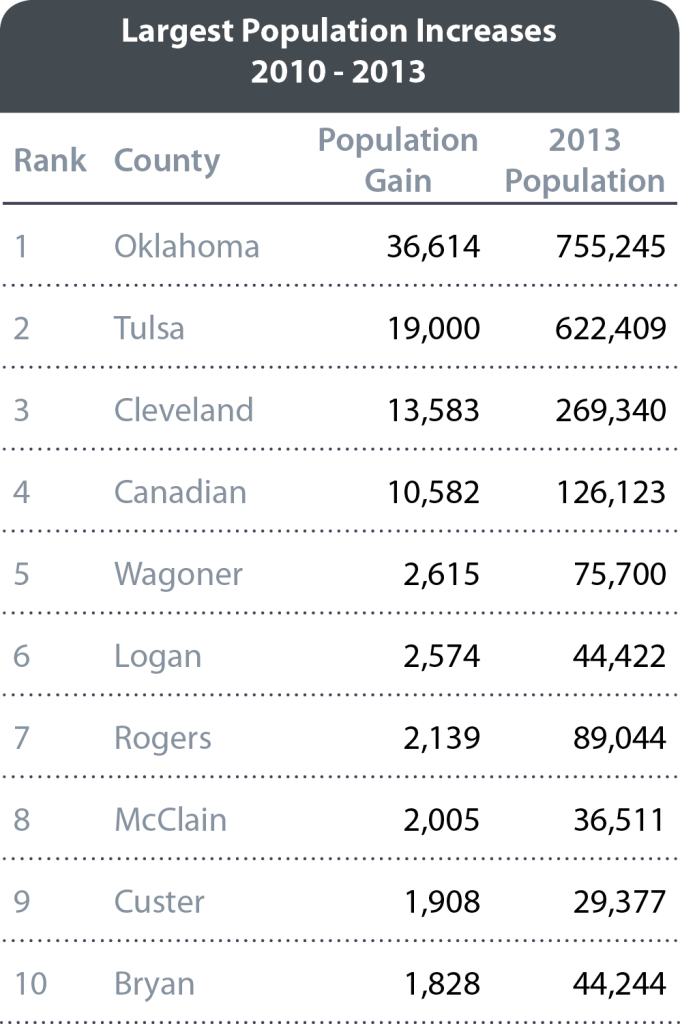
The Census recently released 2013 population estimates for counties. The Census estimates Oklahoma’s total population at 3,850,568. Oklahoma has gained about 100,000 people since 2010.
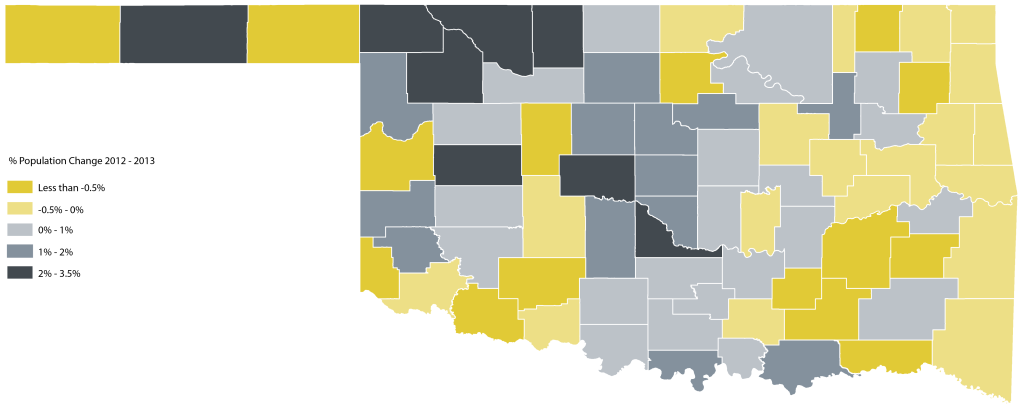
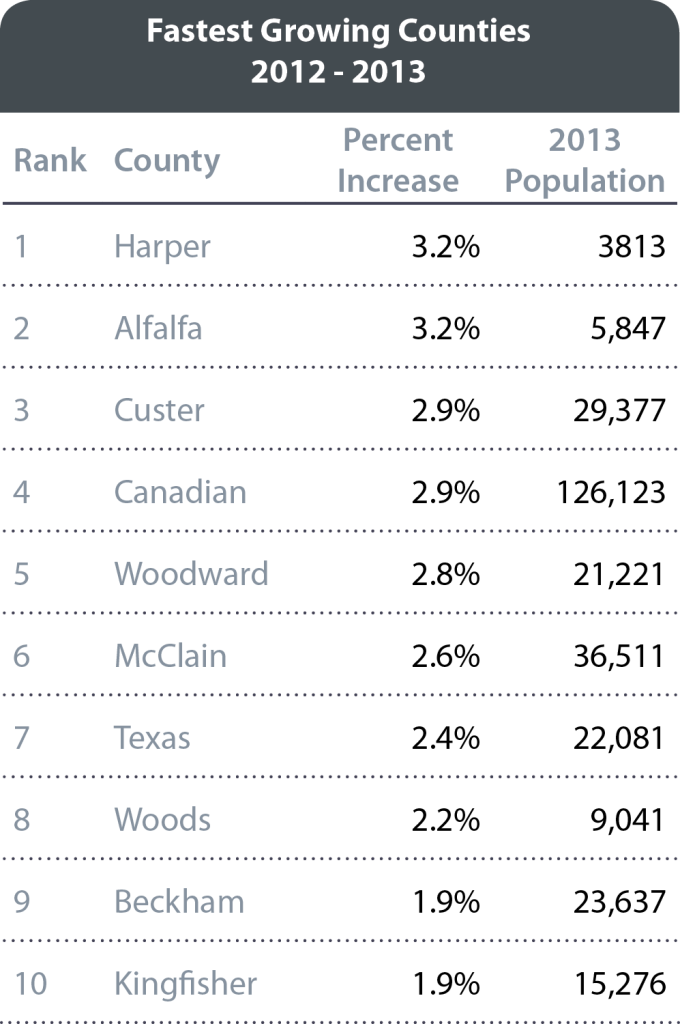
These estimates are based on numerous sources of data and used for important federal formulas such as funding allocation. They can also be used to spot trends of growth and decline across our state. Here we have broken down the data showing the population changes by county over the 1-year period from summer 2012 to summer 2013, and the 4-year period from 2010 to 2013. What patterns do you notice?
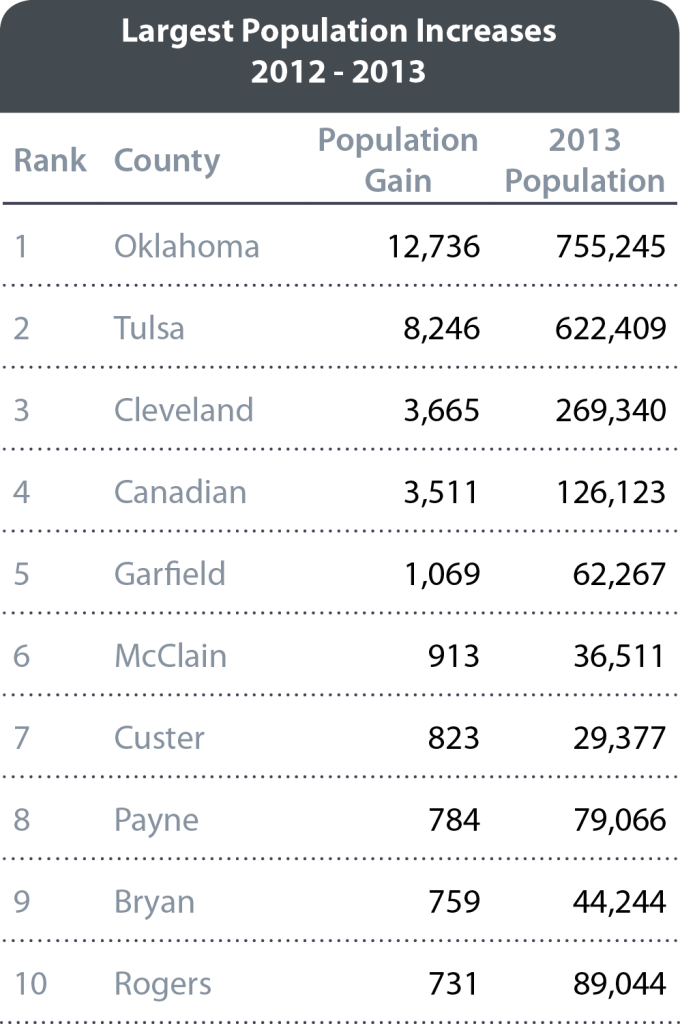
Population Change Between 2012 and 2013
Notes
- The most striking trend is the high rate of growth in parts of northwest Oklahoma- mostly explained by growing energy exploration in the area.
- Oklahoma County added about 35 people each day between 2012 and 2013.
- Five Oklahoma counties were among America’s fastest growing counties (with populations over 10,000): Custer, Canadian, Woodward, McClain, and Texas.
60% of Oklahomans live in Major Metros
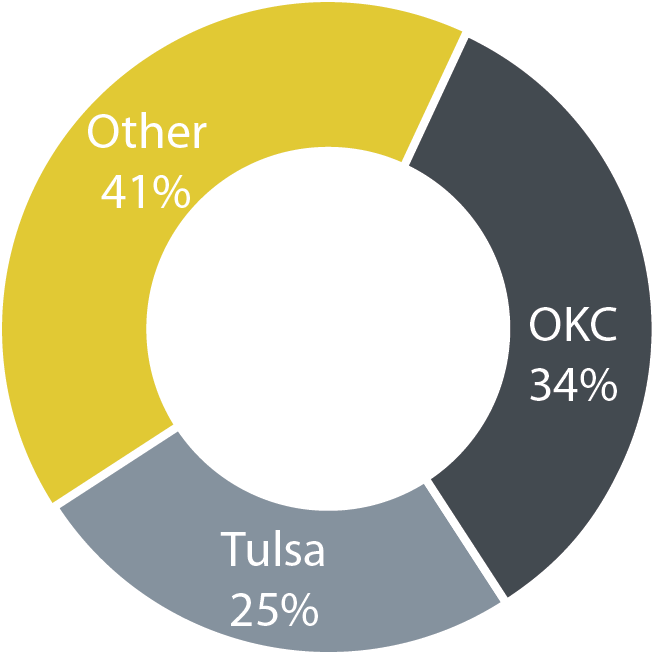
In 2010, 58.3% of Oklahomans lived in the two major metro areas of Oklahoma City and Tulsa. By 2013, that share is up to 59.2%.
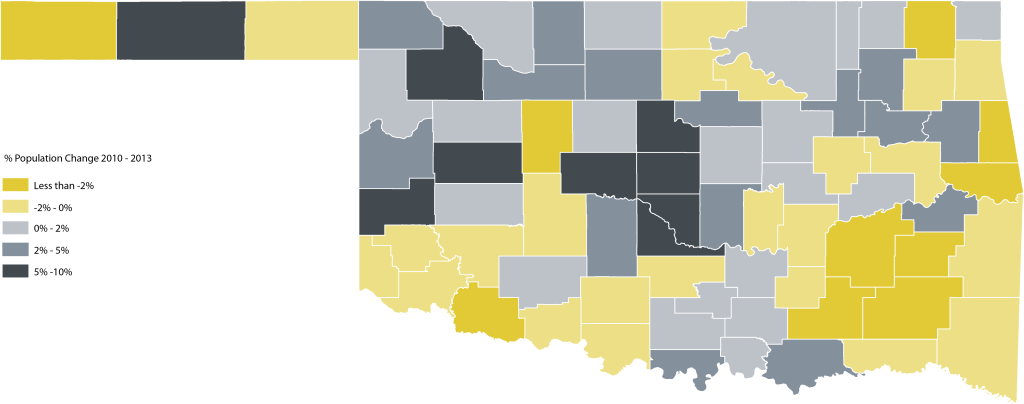
Population Change Between 2010 and 2013
Notes
- Since 2010, the growth of the Oklahoma City region has been a major story for Oklahoma.
- The Oklahoma City metro area has gained nearly 70,000 people since 2010.
- More than 90% of the OKC metro’s growth has occurred in central Oklahoma’s three largest counties: Oklahoma, Cleveland, and Canadian.
- Oklahoma County alone gained 37,000 people.
- The Tulsa region has grown by about 24,000 people since 2010.
- 80% of the Tulsa metro’s growth has occurred in Tulsa County alone.
- Four counties were among America’s 100-fastest growing (with populations of 10,000+).
- Canadian County is the 36th fastest growing county since 2010 in the United States.
