The Census Bureau recently released the newest population estimates for Oklahoma. These yearly estimates are used in allocating federal funds and resources. On July 1st, 2015, the state’s population was estimated to be 3,911,338, which is a gain of about 160,000 people since 2010. This is a 4.3 percent increase which is higher than the total US growth of 3.9 percent during the same period.
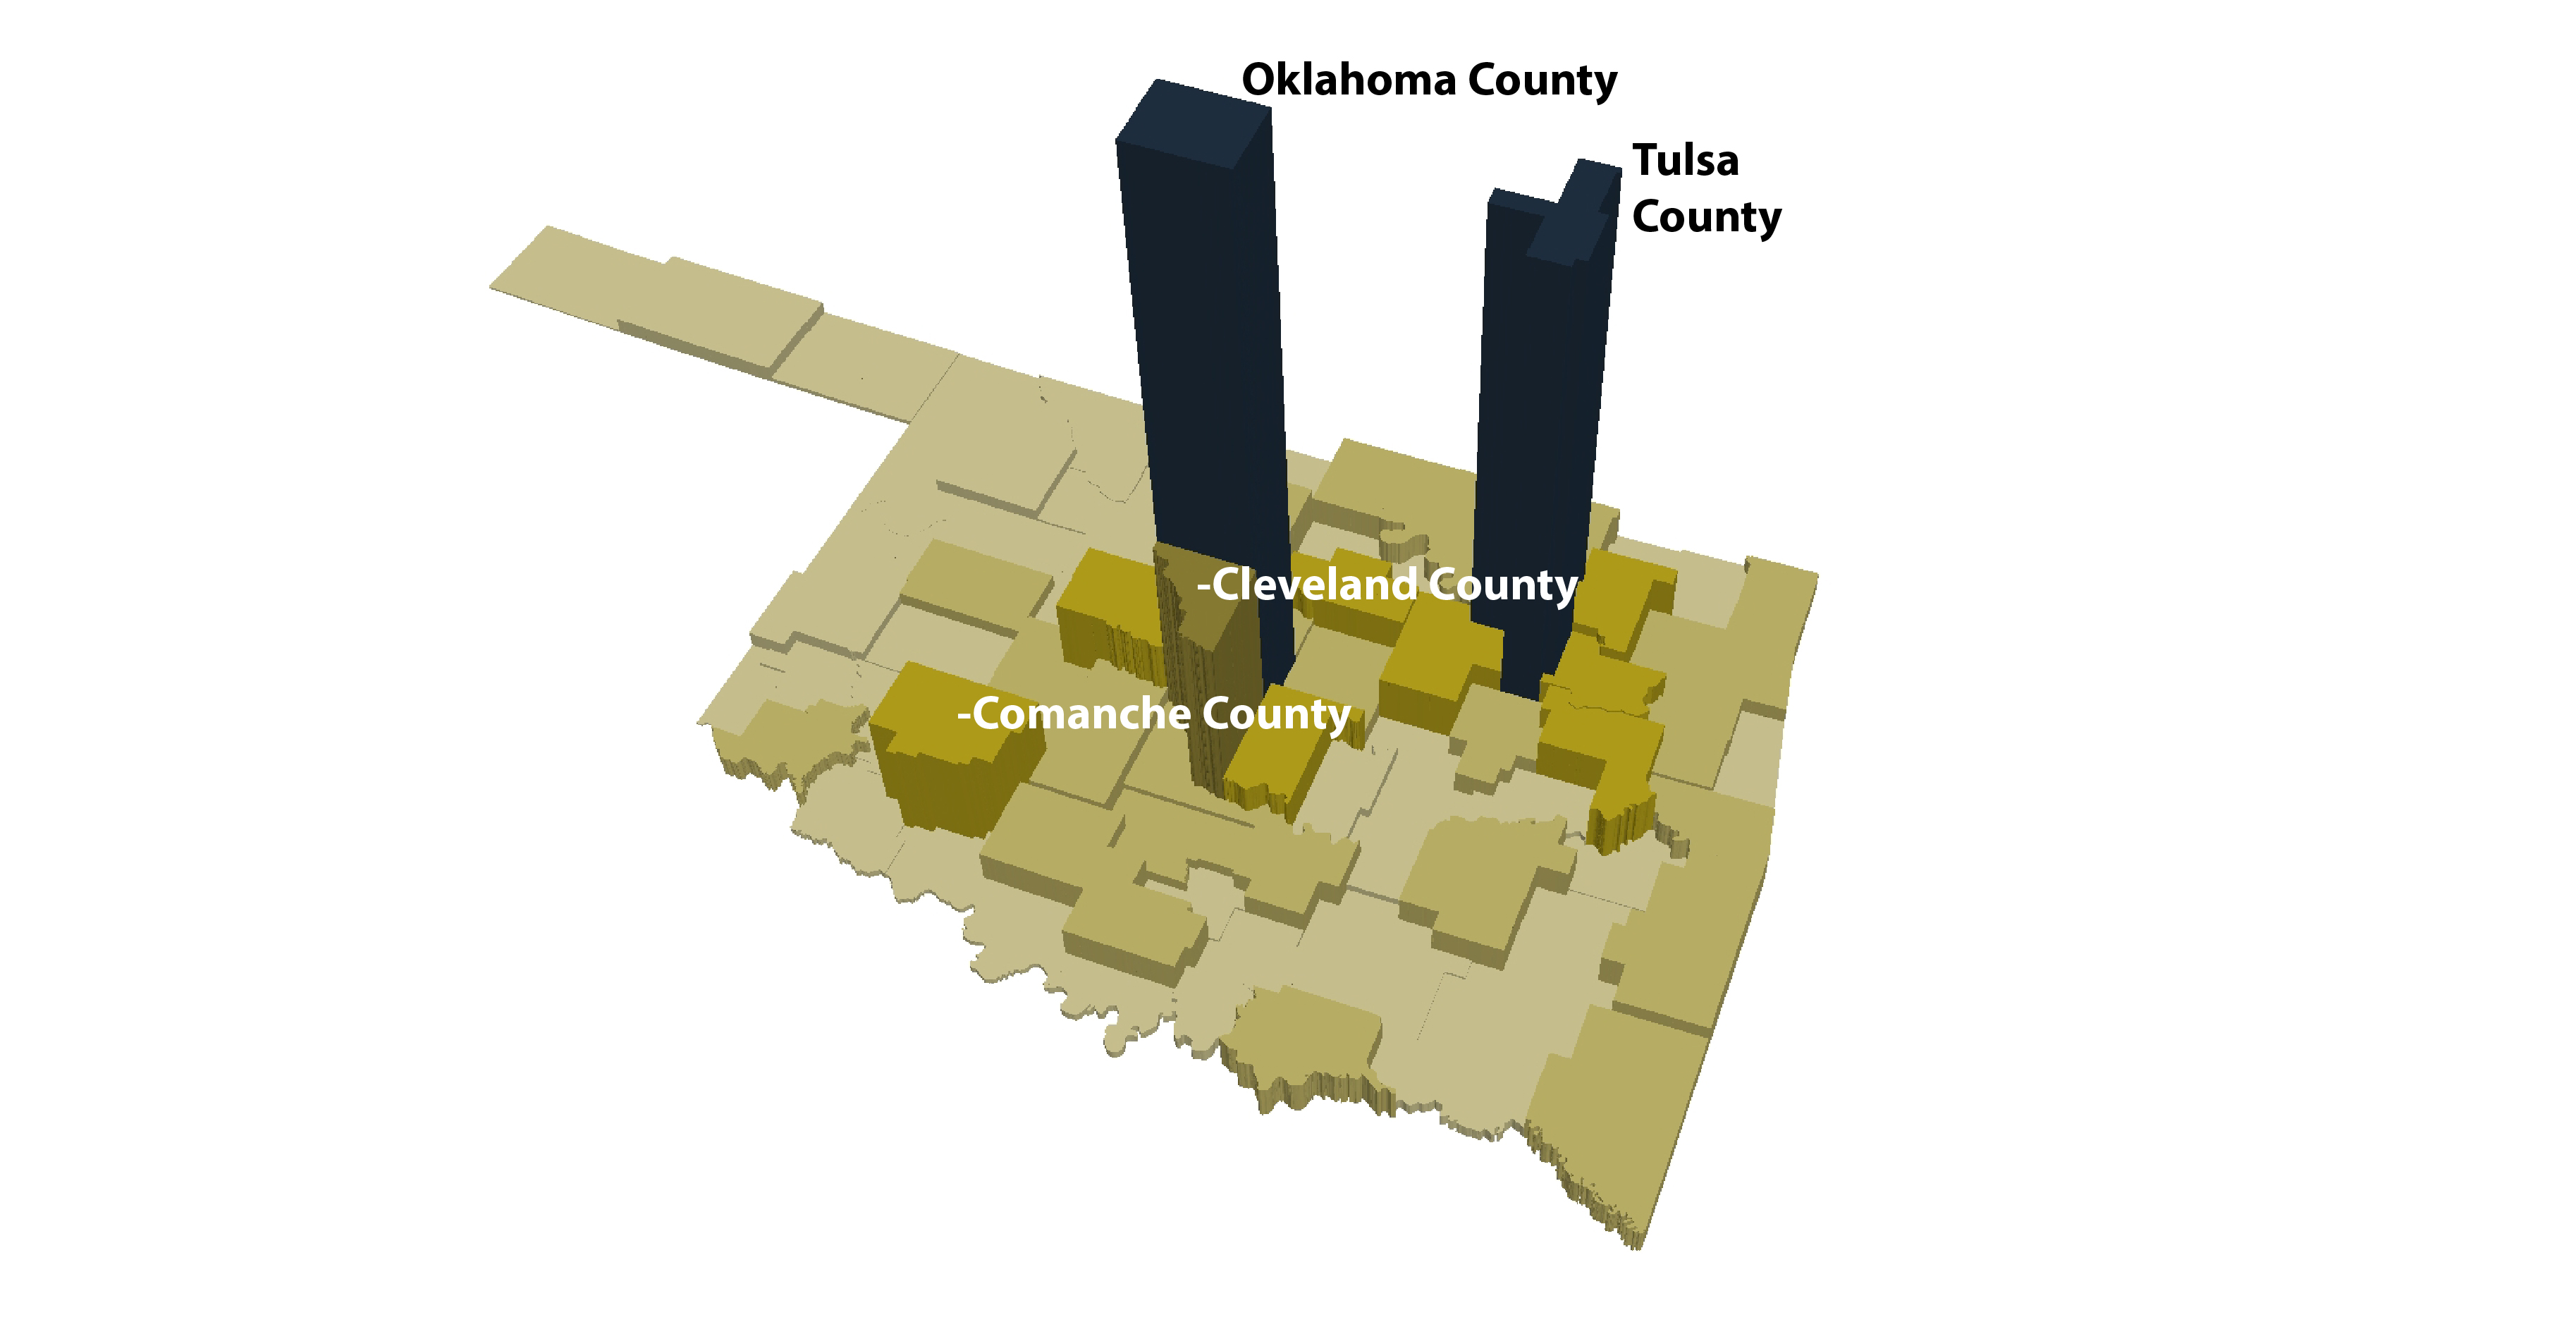
2015 Population Distribution
Before we look at how Oklahoma counties are performing against one another, let’s take a look at how the population is currently spread across the state. Clearly, Oklahoma County and Tulsa County still tower over other counties in terms of population density.
Continued Growth in Metropolitan Centers
In 2010, 58.3% of the Oklahoma population lived in the metro areas of either Tulsa or Oklahoma City. The two major metro areas have an increasing share of Oklahoma’s population. By 2015, the OKC and Tulsa metro areas were home to 60% of the state’s population.

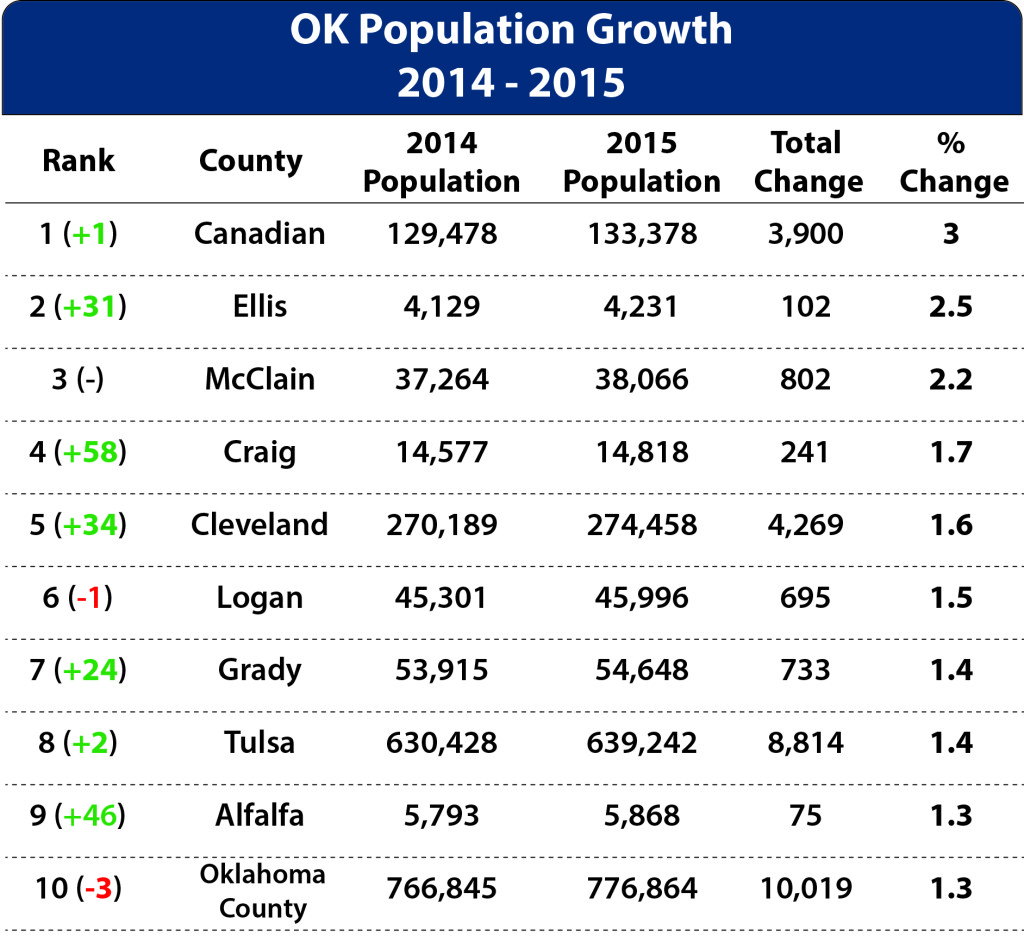
Population Change Between 2014 and 2015
The following map is a representation of percentage change of OK counties from 2014-15. Notice the growth of Oklahoma counties near the Texas border. Considering that Dallas (roughly 90 miles away) grew by 2.3% during this period, it is likely that these counties are experiencing spillover effects of its sprawling growth pattern.
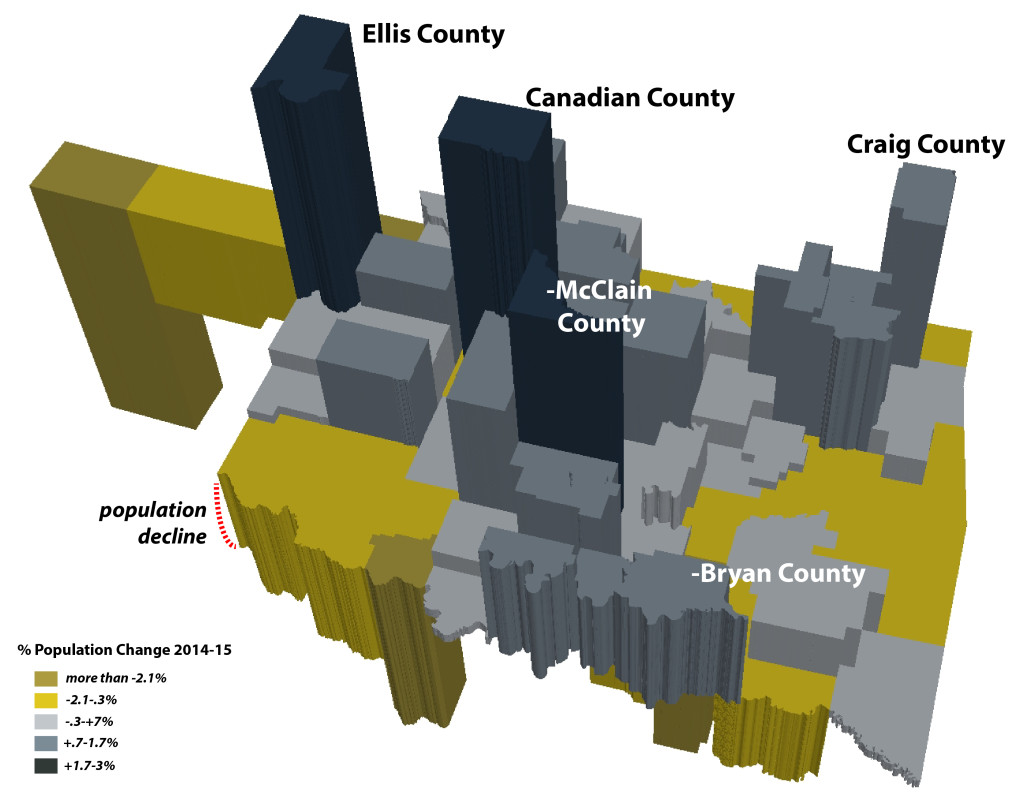
Notes:
- Despite dramatic decreases in population in the panhandle, Ellis County grew by 2.5%.
- Counties surrounding Oklahoma City are continuing to boom.